etcd Is Your Kubernetes Database: What It Does, What Breaks, and What to Watch
etcd kubernetes is the only component in your control plane that holds state — and most teams don’t think about that until the cluster starts behaving in ways they can’t explain.
Kubernetes doesn’t store state in your pods. It doesn’t store state in your nodes, your scheduler, or your API server.
It stores state in etcd. And most teams don’t think about that — until the cluster starts behaving in ways they can’t explain.
If etcd is slow, your cluster is slow. If etcd is inconsistent, your cluster is inconsistent. If etcd fails, your control plane doesn’t degrade. It stops.
What etcd Actually Does
Skip the theory. Here’s the function:
etcd is a distributed key-value store. In Kubernetes, it is the only component that holds persistent state. Every pod definition, every secret, every ConfigMap, every lease, every node registration — all of it is written to etcd first, read from etcd later.
The API server is stateless. It’s a translation layer. You send a request to create a pod, the API server validates it, writes the desired state to etcd, and returns. The scheduler watches etcd. The controller manager watches etcd. The kubelet reports back to etcd — through the API server, which is always reading from and writing to etcd.
Kubernetes is a state machine. etcd is the state.
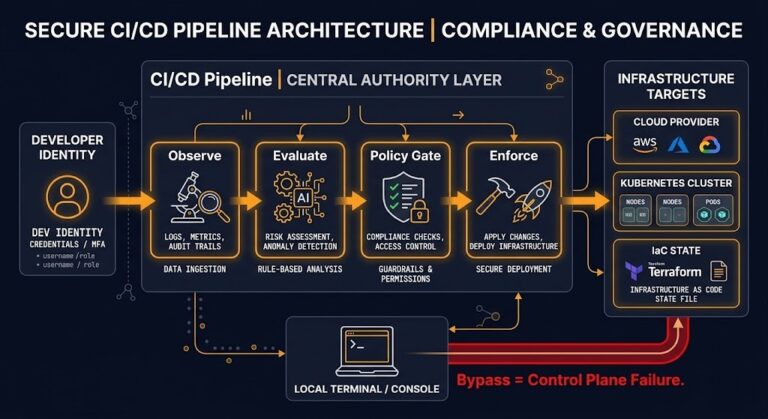
There’s no backup data layer. There’s no fallback. Every control plane decision traces back to etcd being readable, writable, and consistent. This is the same dependency pattern described in The Control Plane Shift — the infrastructure assumption that’s invisible until it fails.
Related: Infrastructure State Gravity — etcd is the literal state-repository example in that framework’s “Three Places” breakdown: a store with forty resources can be redesigned in an afternoon, the same store backing hundreds of production workloads cannot, because the cost stopped being technical the moment everything downstream started depending on it staying exactly as it is.
What Breaks When etcd Is Under Pressure
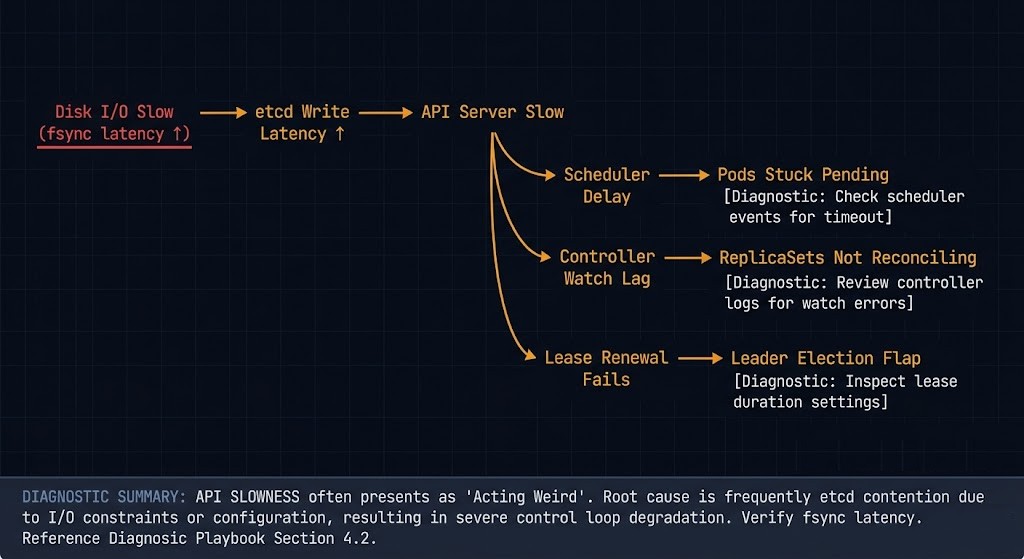
This is where teams get confused. etcd failures don’t present as database failures. They present as Kubernetes acting weird.
⚠ Four Symptoms Engineers Actually See
API server latency spikes
Requests that normally return in milliseconds start taking seconds. kubectl get pods hangs. CI pipelines time out. Nothing looks obviously wrong at the pod level.
Pods stuck in Pending or Terminating
The scheduler can’t confirm placement. The kubelet can’t confirm deletion. The state machine is waiting on writes that aren’t completing.
Controllers not reconciling
Deployments that should be rolling forward aren’t. ReplicaSets that should be scaling aren’t. The controllers are running, but their watch loops are lagging because etcd is behind.
Leader election instability
Components that rely on etcd for leader leases start flapping. You see log storms, unexpected restarts, and failovers that don’t resolve cleanly.
None of these symptoms point directly at etcd in your dashboard. They look like scheduler problems, kubelet problems, or network problems. The actual cause is sitting one layer below everything you’re checking.
The Failure Modes Nobody Monitors
Failure Mode 1 — Disk Latency
etcd is disk-bound. Not CPU-bound, not memory-bound — disk-bound. Every write to the etcd state machine requires an fsync to disk before it acknowledges success. That’s by design. That’s how it guarantees consistency.
If your IOPS are slow, your writes are slow. If your writes are slow, your API server is slow. If your API server is slow, your cluster is slow. The entire call chain collapses to the speed of your disk.
This is why etcd documentation explicitly calls for SSD or NVMe storage. Spinning disk and networked storage — NFS, EBS gp2, low-IOPS tiers — will quietly degrade your control plane under load. The same IOPS discipline that applies to your Enterprise Storage & SDS Logic applies directly here.
Failure Mode 2 — Quorum Instability
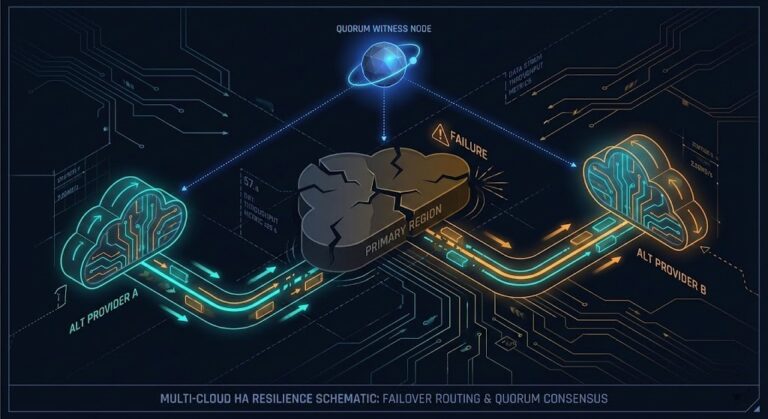
etcd uses Raft consensus. A 3-node cluster requires 2 nodes to agree. A 5-node cluster requires 3. Lose quorum and the cluster goes read-only — no writes, no reconciliation, no scheduling.
The common mistakes: running etcd as a 2-node cluster (no quorum tolerance), running it as a 4-node cluster (tolerates 1 failure, same as 3-node, but costs more), or stretching etcd members across zones with high inter-member latency. Raft heartbeat timeouts are tuned for low-latency networks. Push latency above ~10ms between members and leader elections start triggering under normal load — the kind of instability covered in Kubernetes Day-2 Incidents.
Failure Mode 3 — Large Object Writes
etcd has a default value size limit of 1.5MB per object and a default total database size of 2GB (8GB max with configuration). Both limits are reachable in production clusters that misuse the API.
The typical offenders: large CRDs storing runtime state instead of configuration, secrets used as a blob store, ConfigMaps holding multi-megabyte files. etcd is not an object store. It is not a cache. Every oversized write slows the cluster. Repeated writes to large keys cause fragmentation.
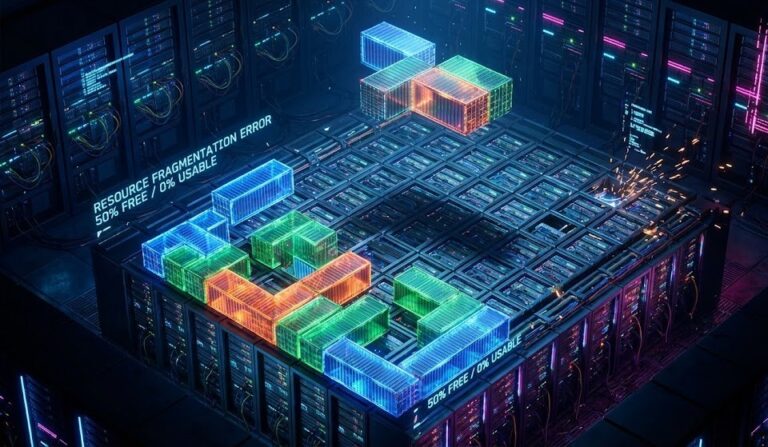
Failure Mode 4 — Compaction and Fragmentation
etcd keeps a history of every revision to every key. That history accumulates. Without compaction, the etcd database grows unbounded. Without defragmentation after compaction, the on-disk footprint doesn’t shrink even after old revisions are purged.
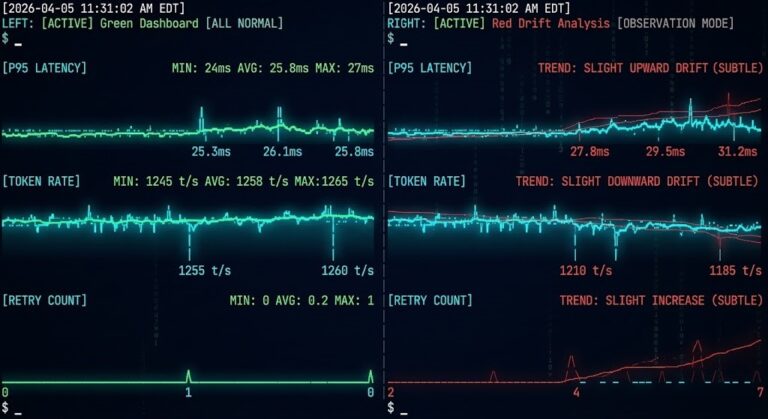
The pattern: database grows to several hundred MB, performance starts softening, no one correlates it to etcd because nothing is explicitly broken yet. Then a large write event pushes the DB toward the size limit and you have an incident. This is the same silent degradation pattern described in 200 OK Is the New 500 — the system looks healthy until it doesn’t.
What to Monitor in etcd Kubernetes Clusters
📊 Core etcd Kubernetes Signals
If you’re only watching CPU and memory on your control plane nodes, you are not monitoring etcd.
etcd_disk_wal_fsync_duration_seconds
Write-ahead log fsync time. P99 above 10ms = warning. P99 above 25ms = problem. This is the single most important etcd metric.
etcd_server_leader_changes_seen_total
Leader elections under normal operation should be near zero. Frequent changes indicate network instability, member timeouts, or disk pressure.
etcd_mvcc_db_total_size_in_bytes
Absolute database size. Track growth rate, not just current value. Growing faster than your cluster is growing means something is over-writing.
etcd_mvcc_db_total_size_in_use_in_bytes
Actual in-use bytes vs. allocated. A large gap between this and total size indicates fragmentation that compaction hasn’t cleaned up.
etcd_server_slow_apply_total
Counter for slow internal apply operations. Nonzero and growing is a signal that deserves investigation before it becomes an incident.
This is the same observability discipline covered in Your Monitoring Didn’t Miss the Incident — the issue isn’t missing data, it’s not knowing which signals to instrument before the incident starts.
Operational Rules
✓ DO
- ✓ Use fast, dedicated local SSD or NVMe for etcd data directories
- ✓ Run 3 or 5 etcd members — always odd, never 2 or 4
- ✓ Monitor fsync latency as your primary etcd health signal
- ✓ Schedule regular compaction and defragmentation — automate it
- ✓ Snapshot etcd regularly — treat it like a production database backup
- ✓ Keep etcd members in the same region with low inter-member latency
✗ DON’T
- ✗ Co-locate etcd on nodes with noisy, high-I/O workloads
- ✗ Store large payloads in ConfigMaps or Secrets
- ✗ Ignore fragmentation growth — it compounds silently
- ✗ Stretch etcd members across high-latency zones without tuning election timeouts
- ✗ Assume managed etcd (EKS, GKE, AKS) requires no visibility — you still need the metrics
The Architectural Reality
Most Kubernetes architectures are designed assuming etcd works.
Very few are designed for when it doesn’t.
The control plane is not a redundant system in the way your application tier is. Your pods can fail and reschedule. Your nodes can fail and drain. etcd loses quorum and your cluster stops accepting writes — full stop. No clever failover, no automatic recovery, no workload that routes around it.
This is not a reason to panic. It’s a reason to treat etcd with the same operational rigor you’d apply to your primary production database. You back up your database. You monitor your database. You capacity plan your database. The Kubernetes Cluster Orchestration pillar covers the broader pattern — etcd health is the foundation that tier sits on.
The Control Plane Shift identified this exactly: the architectural decisions that surface last are the ones built into every assumption underneath the stack. etcd is the floor that assumption sits on.
Most teams discover their etcd kubernetes health is degraded the same way: the control plane starts failing and nothing obvious explains it. By the time etcd surfaces as the root cause, the incident is already in progress.
You don’t debug Kubernetes without debugging etcd — whether you realize it or not.
Architect’s Verdict
etcd kubernetes operations is not a specialization. It’s table stakes for anyone running production clusters.
✓ DO
- ✓ Run dedicated fast disks for etcd — non-negotiable in production
- ✓ Set up fsync latency alerting before you need it
- ✓ Automate compaction and defragmentation on a schedule
- ✓ Snapshot etcd as part of your backup strategy — same discipline as the Backup Architecture pillar
- ✓ Monitor leader change rate as a control plane health signal
✗ DON’T
- ✗ Treat etcd as a transparent Kubernetes implementation detail
- ✗ Store non-configuration data in ConfigMaps or Secrets
- ✗ Assume your managed control plane handles etcd health visibility for you
- ✗ Let fragmentation accumulate — it degrades silently until it doesn’t
- ✗ Ignore etcd metrics because your pods look healthy
If etcd is slow, Kubernetes lies to you. If etcd is unavailable, Kubernetes stops. If etcd is corrupted, recovery becomes a rebuild problem — not a restart.
You already know your application database needs operational attention. etcd is the most important database in your cluster. Start treating it like one.
Additional Resources
Editorial Integrity & Security Protocol
This technical deep-dive adheres to the Rack2Cloud Deterministic Integrity Standard. All benchmarks and security audits are derived from zero-trust validation protocols within our isolated lab environments. No vendor influence.
R.M.
Senior Solutions Architect with 25+ years of experience in HCI, cloud strategy, and data resilience. As the lead behind Rack2Cloud, I focus on lab-verified guidance for complex enterprise transitions. View Credentials →
Get the Playbooks Vendors Won’t Publish
Field-tested blueprints for migration, HCI, sovereign infrastructure, and AI architecture. Real failure-mode analysis. No marketing filler. Delivered weekly.
Select your infrastructure paths. Receive field-tested blueprints direct to your inbox.
- > Virtualization & Migration Physics
- > Cloud Strategy & Egress Math
- > Data Protection & RTO Reality
- > AI Infrastructure & GPU Fabric
Zero spam. Includes The Dispatch weekly drop.
Need Architectural Guidance?
Unbiased infrastructure audit for your migration, cloud strategy, or HCI transition.
>_ Request Triage Session