BUSINESS CONTINUITY & RESILIENCE
Systems Must Operate Before They Can Recover.
Business continuity architecture solves a problem DR doesn’t: keeping systems operational while the failure is still active. Recovery plans assume the system goes down. Business continuity assumes going down is unacceptable.
Most organizations have invested heavily in disaster recovery — replication, failover orchestration, DR runbooks, annual tests that validate infrastructure boot. What they have not invested in is the layer above it: the architecture that keeps systems operating while the failure is still active. DR is an interruption discipline. Business continuity is an operation discipline. One accepts downtime as inevitable. The other treats it as a design failure.
The gap between those two disciplines is where business damage actually accumulates. Failover takes minutes to hours. Revenue loss, SLA penalties, customer trust erosion, and operational disruption happen in the same window. Multi-cloud architectures don’t prevent this — they make failures cascade faster when the continuity layer wasn’t built. If your only plan is failover, your system was designed to go down.
The Continuity Illusion
Most organizations believe they have business continuity because they have disaster recovery. They don’t. DR is a specific tool for a specific problem. Treating it as a BC strategy produces architectures that look correct in documentation and collapse under the failure conditions they were designed to address.
| What Teams Believe | What It Actually Means |
|---|---|
| DR = resilience | DR = interruption tolerance — it accepts downtime and recovers from it |
| Failover = success | Business disruption accumulates during the entire failover window — infrastructure recovering does not equal business operating |
| High availability = uptime | HA prevents certain failure modes but does not prevent service degradation under load or cascading failures |
| Multi-region = safe | Failures cascade through shared control planes regardless of region count — redundant compute with a shared DNS or identity plane fails as a unit |
| We have a BC plan | Most BC plans describe what to recover — not how to operate while the failure is still active |
Availability vs Continuity vs Recovery
These four concepts are used interchangeably in most infrastructure documentation. They are not the same discipline. They don’t solve the same problem. Investing in one does not substitute for the others — and the order matters more than most architectures acknowledge.
| Concept | What It Actually Means | Primary Metric | What It Doesn’t Solve |
|---|---|---|---|
| High Availability | Preventing failure — redundancy and fault tolerance before the event | Uptime % | Cascading failures, control plane loss, adversarial conditions |
| Disaster Recovery | Restoring availability after failure — interruption is accepted and recovered from | RTO / RPO | Operating during failure, data integrity, adversarial recovery |
| Business Continuity | Operating during failure — interruption is not acceptable, degraded operation is by design | MTTD / Service Continuity | Data integrity restoration, post-incident cleanup |
| Recovery | Restoring correct state — integrity after availability is restored | Recovery Assurance | Speed of restoration, operating during failure |
High Availability prevents failures where possible. Business Continuity operates through failures that HA couldn’t prevent. Disaster Recovery restores systems after failures BC couldn’t sustain. Recovery validates that what DR restored is trustworthy. All four are required. None substitutes for the others.
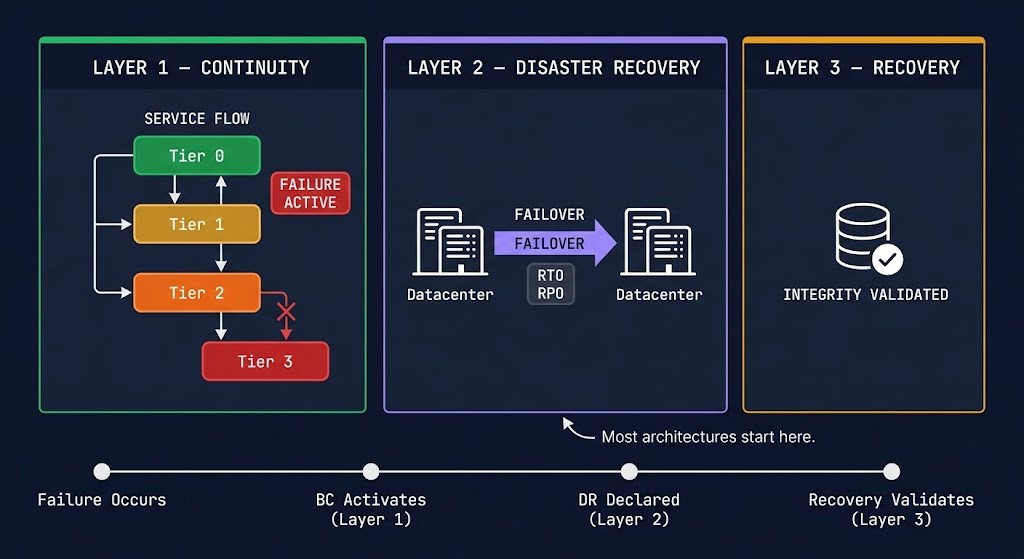
The Three-Layer Resilience Model
Complete resilience architecture operates on three distinct layers. Most organizations build Layer 2, assume Layer 3 follows automatically, and never build Layer 1. The result is an architecture that handles infrastructure failure but not business impact — and that treats every failure as an interruption when most failures only require degradation.
The Disaster Recovery & Failover page covers Layer 2 in full depth — failover sequencing, replication architecture, and the seven-step recovery sequence. The Data Protection Architecture pillar covers the full three-plane protection model including Layer 3 integrity. This page owns Layer 1 — the layer that most architectures skip entirely.
What Business Continuity Actually Is
Business continuity is not disaster recovery with a different name. It is not a high availability configuration. It is not a BIA spreadsheet or a policy document. It is the architecture that keeps systems operating — at reduced capacity, with degraded features, under prioritized load — while the failure is still active and DR has not yet completed.
The distinction is temporal. DR begins after interruption is declared. BC operates during the window before and during that interruption — the window where business damage accumulates fastest. A ransomware dwell period. A partial regional failure. A traffic spike that degrades one service without taking the entire system down. These are continuity scenarios, not DR scenarios. DR has nothing to offer until after the failure is complete and declared.
Business continuity is three operational disciplines working together: degraded operation by design (systems know how to run at reduced capacity), workload prioritization under failure (Tier 0 stays online while Tier 2 sheds), and partial service availability (the system serves its most important users and functions while everything else defers).
The difference between a system that goes dark and a system that degrades gracefully is not a recovery configuration. It is an architectural decision made before the failure — starting with whether your control plane has a single point of failure that continuity architecture would expose immediately.
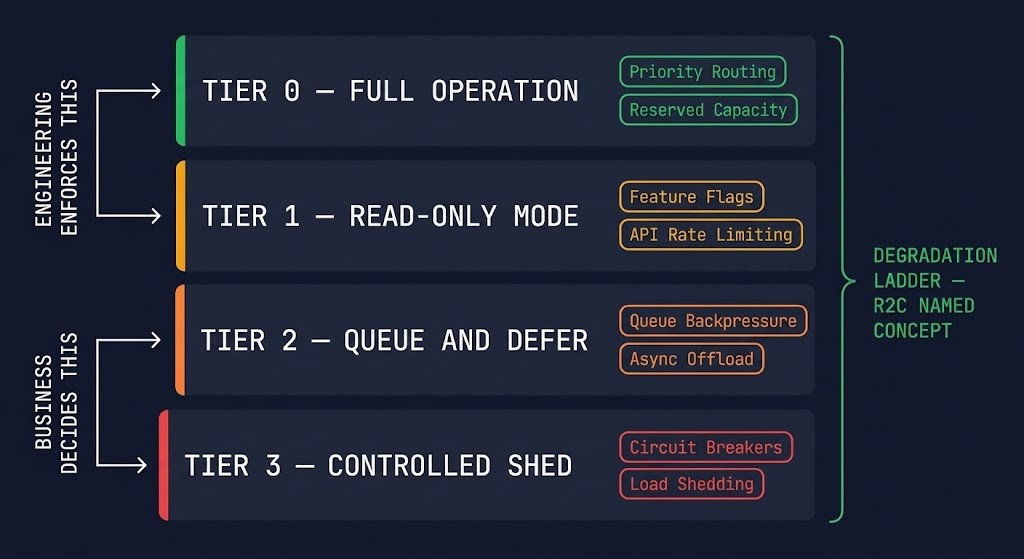
The Degradation Ladder
The Degradation Ladder is the core operational model for business continuity architecture. It defines how a system intentionally reduces its operational footprint under failure — not as a failure mode, but as a designed response sequence with explicit enforcement mechanisms at each tier.
The ladder works because each tier is enforced, not aspirational. Tier 0 stays online because priority routing and reserved capacity guarantee it. Tier 1 enters read-only mode because feature flags disable write operations when a defined health threshold is crossed. Tier 2 defers because queue backpressure prevents downstream overload. Tier 3 sheds gracefully because circuit breakers reject requests before the system fails under load. Without the enforcement mechanism, the ladder is a diagram. With it, the ladder is an architecture.
| Tier | Operational State | Enforcement Mechanism | Failure Mode if Skipped |
|---|---|---|---|
| Tier 0 | Full operation maintained — mission-critical functions unaffected | Priority routing, reserved capacity pools, traffic class enforcement | Mission-critical workloads compete with degraded services for remaining capacity |
| Tier 1 | Reduced capacity — read-only mode, non-critical writes disabled | Feature flags, API rate limiting, write-path circuit breakers | Write amplification under failure floods the database tier |
| Tier 2 | Queue-based acceptance — work accepted, processing deferred | Queue backpressure, async offload, dead-letter queue with replay | Synchronous processing overwhelms downstream services still operating |
| Tier 3 | Controlled shed — requests gracefully rejected with defined response | Circuit breakers, load shedding rules, priority-based request rejection | System accepts requests it cannot serve — timeout storm triggers cascade |
The tier assignment is an architecture decision, not an infrastructure decision. The enforcement mechanism is engineering. But which workloads belong at which tier — what features remain available, which users get prioritized, what gets degraded or removed first — is a product and business decision that most engineering teams make unilaterally during incidents. The Degradation Ladder only works if the tier assignments were made before the failure, documented, and agreed on by the business. Who decided what Tier 0 means for your system? Was it ever written down?
Continuity Architecture Patterns
Six architectural patterns implement business continuity. Each solves a specific failure mode. None solve all of them. The pattern selection is a function of workload type, failure domain, and the tier assignments from the Degradation Ladder.
The Control Plane Is the Continuity Boundary
Every continuity architecture pattern above depends on one assumption: that the control plane making routing, traffic, and prioritization decisions is still functioning. DNS, API gateways, and traffic steering logic are the BC control plane. If they fail, no continuity architecture holds — regardless of how many active-active regions, circuit breakers, or feature flags are configured.
This is the BC equivalent of the identity isolation problem on the DR page. Identity is the most common single point of failure in infrastructure architecture — and for business continuity, the routing control plane is equally fragile when not treated as a first-class architectural concern.
The test is simple: can your routing control plane make decisions independently of the production environment it routes? If your API gateway authenticates through the same identity provider as the production services it fronts — and that identity provider fails — the gateway can’t process requests. If your DNS failover health checks depend on a monitoring system hosted in the same failure domain — the health checks fail simultaneously with the production services they’re watching. If your traffic steering decisions require a centralized controller that isn’t itself highly available — the controller becomes the failure mode your continuity architecture was designed to prevent.
Three questions that define whether your continuity control plane is real: Can your API gateway process requests if your production identity provider is unreachable? Can your DNS failover detect a regional failure if your monitoring is in that region? Can traffic be rerouted if your traffic controller’s management plane is in the failure domain? Any “no” answer is a shared control plane — and shared control planes fail as a unit.
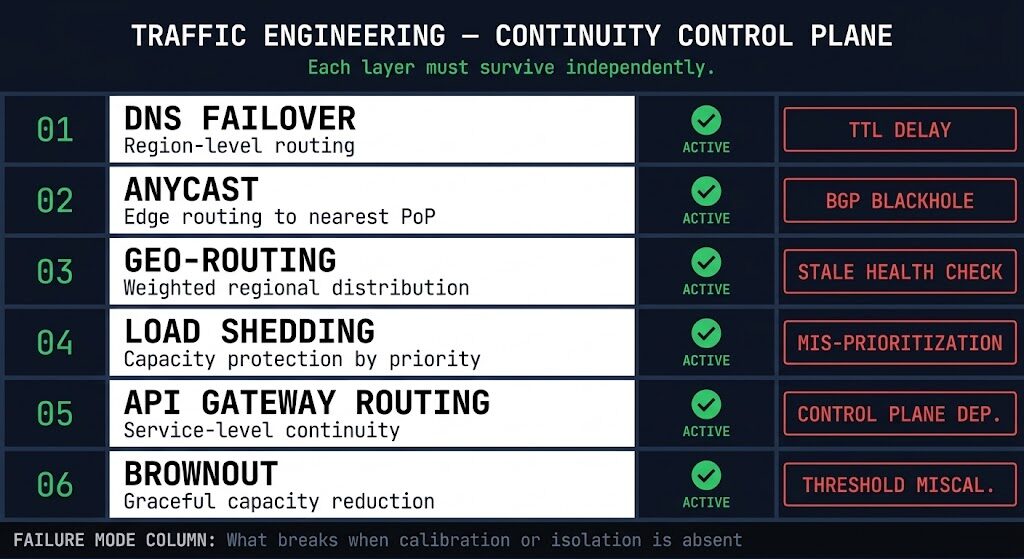
Traffic Engineering for Continuity
Traffic engineering is the concrete implementation layer of business continuity. DNS failover, anycast routing, geo-routing, and load shedding are not abstract concepts — they are mechanisms with specific failure modes, calibration requirements, and operational constraints that determine whether continuity architecture works under real incident conditions.
| Mechanism | What It Controls | Key Calibration | Failure Mode |
|---|---|---|---|
| DNS Failover | Region-level routing — directs traffic away from failed endpoints | TTL pre-staged to 30–60s before incident; health check interval and failure threshold | TTL not pre-staged — cached resolution persists for hours post-failover; stale health checks routing to degraded endpoints |
| Anycast | Edge-level routing — routes clients to nearest healthy PoP | BGP advertisement health; PoP withdrawal timing under failure | Blackhole routing under partial failure — PoP withdraws, BGP propagation delay causes traffic black hole before re-convergence |
| Geo-Routing | Regional distribution — routes by geography with weighted failover | Health check freshness; failover weight thresholds; latency-based routing policy | Stale health checks — geo-routing continues directing traffic to a degraded region because the health check hasn’t expired yet |
| Load Shedding | Capacity protection — rejects requests beyond defined thresholds | Shed threshold; priority classification accuracy; rejection response behavior | Mis-prioritization — shedding drops Tier 0 traffic because classification wasn’t enforced at the gateway layer |
| API Gateway Routing | Service-level continuity — routes requests to available backend instances | Gateway availability independence; auth plane isolation; circuit breaker configuration | Control plane dependency — gateway authenticates through the same identity provider as the services it fronts; shared failure |
| Brownout | Graceful capacity reduction — intentionally degraded service to protect core operations | Brownout threshold vs shed threshold separation; user-facing messaging | Threshold miscalibration — brownout triggers on transient load spikes, creating unnecessary degradation without an underlying failure |
The most common single failure across all traffic engineering mechanisms is health check freshness. Every routing decision is only as current as the last valid health check. Health checks that run every 30 seconds with a 3-failure threshold take up to 90 seconds to detect a failure — in that window, traffic continues routing to a failed endpoint. Pre-staging TTLs before incidents and running health checks from outside the failure domain they’re monitoring are the two calibration decisions that determine whether traffic engineering routes around failures, or routes into them.
The Continuity Cascade
Business continuity failures are not isolated events. They cascade. The pattern is consistent enough that it has a name — and recognizing it before it completes is the difference between a degraded incident and a system collapse.
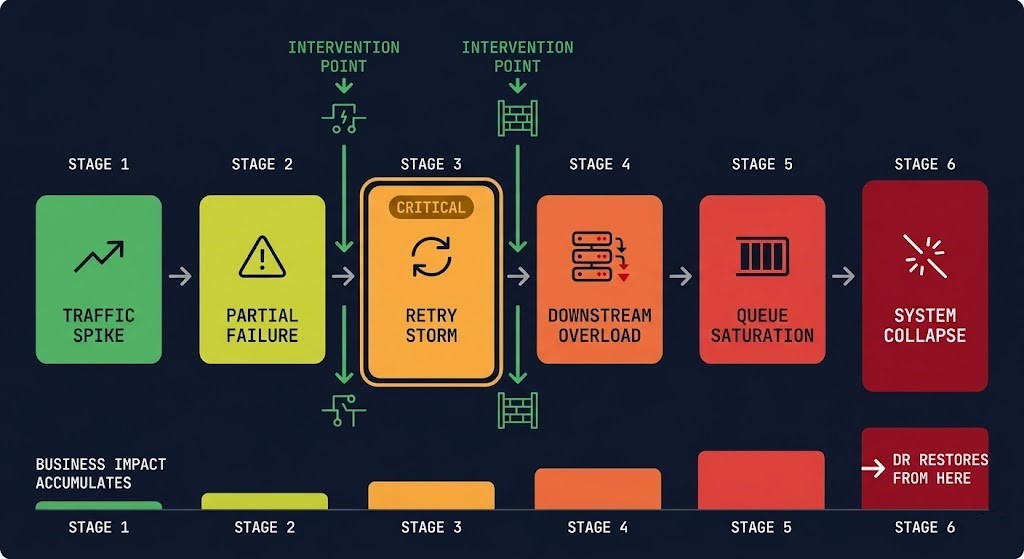
Multi-cloud architectures accelerate the cascade — failures propagate through shared dependencies faster when those dependencies span regions and providers without isolation boundaries. The cascade sequence is the same. The blast radius is larger.
Failure Modes Unique to Business Continuity
These are the failure scenarios DR doesn’t address — the conditions where infrastructure is technically healthy but the business is operationally down. Each requires a BC-specific architecture response, not a recovery runbook.
| Failure Type | What Actually Happens | Why DR Doesn’t Solve It |
|---|---|---|
| Cascade Failure | Partial failure amplifies via retry storm until the entire system collapses from a single degraded service | DR restores what collapsed — BC prevents the cascade. DR has nothing to offer until after Stage 6. |
| Control Plane Failure | DNS, routing, or API gateway fails — no routing decisions are possible, no failover can execute | DR failover requires a functioning control plane to execute. If the control plane is down, DR can’t be triggered. |
| Dependency Collapse | One service failure propagates through undocumented dependencies — services with no role in the original failure collapse downstream | DR replicates the dependency chain — BC isolates it. DR restores everything including the dependency that caused the cascade. |
| Overload Under Recovery | DR completes — systems restored. Recovery traffic returns at full volume simultaneously. The restored system immediately fails under reconnection load. | DR completes but doesn’t control re-onboarding pace. BC traffic management governs how load returns — without it, restoration triggers re-failure. |
| Partial Regional Failure | One AZ or zone degrades — not enough to trigger DR declaration, but enough to degrade service for a portion of users | DR requires a declaration threshold. Partial degradation that doesn’t meet that threshold is a BC problem — not a DR problem. |
Cost Physics of Business Continuity
Business continuity is expensive. DR is cheaper at steady state. Most organizations make this tradeoff explicitly — they invest in DR and accept the business impact of the continuity gap. The problem is that most organizations make this tradeoff implicitly, without modeling the failure-state cost they’re accepting.
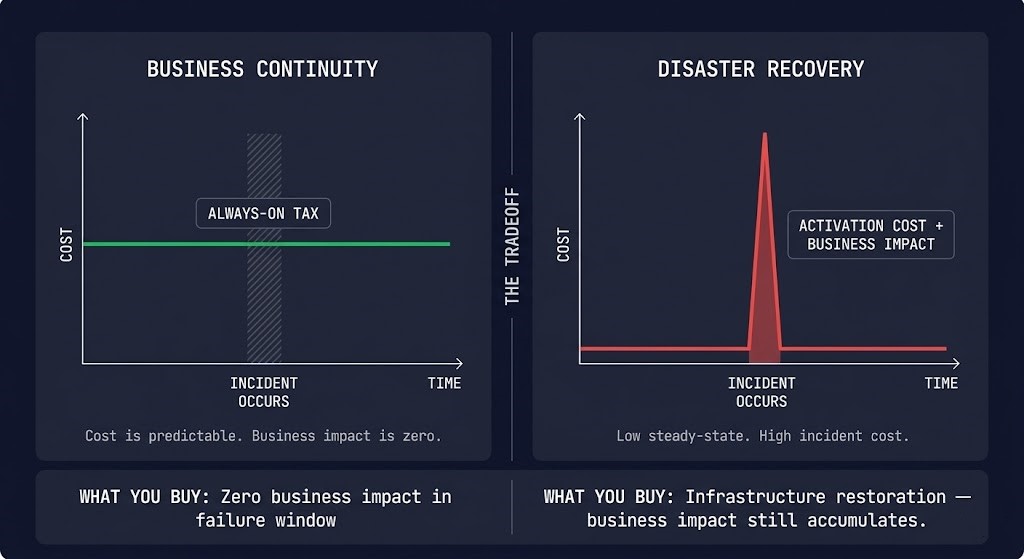
Continuity is a permanent cost. DR is an event cost. Active-active infrastructure, priority routing, circuit breakers, feature flag systems, queue infrastructure, and the engineering overhead to maintain calibration — all of this runs continuously, regardless of whether a failure is occurring. The cost shape is flat, always-on, and predictable.
| Model | Cost Shape | When You Pay | What You’re Buying |
|---|---|---|---|
| Business Continuity | Flat — always-on tax | Always, regardless of incident frequency | Elimination of business impact during the failure window — before DR executes |
| Disaster Recovery | Spiky — incident-driven with standby baseline | Standby always; spike on activation | Infrastructure restoration — business impact still accumulates during RTO window |
| Neither | Zero steady-state — pay only on failure | Only on incident — at incident rates | Nothing — full business impact for the full failure duration |
The correct economic model is the failure-state cost, not the steady-state cost. At $500K+ per hour of enterprise downtime, the always-on tax of continuity architecture typically justifies itself within the first prevented incident. The calculation changes for smaller organizations, lower-criticality workloads, and systems where downtime is genuinely tolerable — which is why the honest assessment of when continuity is the wrong investment matters as much as the architecture that builds it correctly.
Workload Continuity Tiers
Continuity investment scales with workload criticality. Not every system requires active-active architecture. The architecture doesn’t change — the pattern depth and enforcement requirements do.
| Workload Tier | Continuity Requirement | Pattern | Test Frequency |
|---|---|---|---|
| Tier 0 — Mission Critical Transaction systems, identity, payment rails |
No interruption — continuity maintained through all failure scenarios | Active-Active + Priority Routing + Bulkhead Isolation | Quarterly |
| Tier 1 — Business Critical Customer-facing apps, core APIs, auth services |
Degraded operation acceptable — read-only or reduced function during failure | Graceful Degradation + Circuit Breakers + Feature Flags | Semi-annual |
| Tier 2 — Operational Reporting, analytics, non-critical integrations |
Partial interruption acceptable — work accepted and deferred under failure | Queue-Based Decoupling + Backpressure | Annual |
| Dev / Test / Batch Non-production, batch processing, archival |
Full interruption acceptable — no continuity requirement | Document rebuild procedure — no continuity architecture required | None required |
Continuity Testing Model
A continuity architecture that has never been tested is a theory. Unlike DR — where the test validates whether infrastructure boots — continuity testing validates whether the system behaves correctly under degraded conditions. The pass criteria are different. The failure modes are different. Three test levels, executed in order, build confidence equivalent to the four-criteria DR testing model on the Disaster Recovery & Failover page.
The most common gap is Level 3 — control plane failure simulation. Most organizations have never deliberately broken their DNS failover or API gateway to validate fallback behavior. The test requires careful scoping so production impact is bounded, but it is the only way to confirm that the control plane isolation described in the previous section is real rather than assumed. The RTO Reality post on recovery drills covers the same testing philosophy for the DR layer — the principle is identical: untested architecture is theoretical architecture.
Continuity Is a Product Decision
The Degradation Ladder is enforced by engineering. The tier assignments are a product decision. This distinction matters because most engineering teams make tier assignments unilaterally — during incidents, under pressure, without business input — and discover they made the wrong call when the wrong features were degraded for the wrong users at the wrong time.
Business continuity decisions define what features remain available during failure, which users are served at full capacity, what gets degraded or removed first, and in what sequence. These are not infrastructure parameters. They are product and business priority decisions that happen to be enforced by infrastructure. A payment flow that goes read-only during failure may be technically correct and commercially catastrophic. A reporting dashboard that stays fully operational while the transaction API is shedding load is an engineering decision that was never reviewed by the business.
The continuity architecture is only as correct as the tier assignments it enforces. Building the enforcement mechanisms without agreement on the tier assignments produces a degradation ladder that runs perfectly and degrades the wrong things.
BC Decision Framework
| Scenario | Architecture Decision | Tradeoff | Risk if Skipped |
|---|---|---|---|
| Zero tolerance for user-facing interruption | Active-Active + Priority Routing | Highest cost — full capacity running at both sites; write conflict resolution required | Business impact accumulates in full during any single-site failure window |
| Degraded function acceptable, total outage not | Graceful Degradation + Feature Flags + Circuit Breakers | Lower cost — single active site with degradation logic; feature flag system required | No degraded mode means outage when full operation unavailable — binary failure |
| Async workloads — processing deferral acceptable | Queue-Based Decoupling + Bounded Queues | Low cost — queue infrastructure required; replay logic needed for failure recovery | Synchronous processing overwhelms downstream under failure; silent work loss if queues unbounded |
| High-traffic with predictable spike patterns | Load Shedding + Brownout thresholds | Calibration overhead — thresholds require ongoing tuning as traffic patterns change | Cascade under spike — service fails under load that was survivable with shedding active |
| Microservices with complex dependency chains | Bulkhead Isolation + Dependency Map + Circuit Breakers | Implementation overhead — resource pool partitioning and dependency documentation required | Dependency collapse — one service failure propagates to all dependents sharing the same resource pool |
When Continuity Is the Wrong Investment
Business continuity architecture is expensive, operationally complex, and requires ongoing calibration. For some workloads and some organizations, it is the wrong investment — not because resilience doesn’t matter, but because the cost of continuity exceeds the cost of the downtime it prevents.
Batch workloads. Processing that runs on a schedule and produces no user-facing impact when delayed has no continuity requirement. Accept the failure, requeue the job, process when capacity returns. Continuity architecture for batch workloads is overhead with no return.
Internal tools and back-office systems. Teams tolerate downtime on internal tooling that would be unacceptable for customer-facing systems. The cost of a two-hour outage on an internal reporting dashboard is engineering labor time, not revenue loss or SLA penalty. Backup and restore with a documented rebuild path is the correct investment.
Early-stage organizations. Investing in continuity architecture before product-market fit is cost misallocation. Recovery before continuity — build DR first, add continuity when you have the traffic, the revenue, and the operational complexity to justify it. Active-active infrastructure at $50K MRR is not risk management. It is architecture debt at a stage where the business risk is commercial, not operational.
Stateless, immutable systems. Containerized, stateless applications deployed from IaC can be rebuilt faster and cleaner than continuity architecture can maintain them. A rebuild from source is cleaner than maintaining degraded operation for a system that carries no state. Immutable infrastructure that can be reprovisioned in minutes doesn’t need a degradation ladder — it needs a fast rebuild path.
When Business Continuity Architecture Fails
Honest failure conditions — the scenarios where a technically correct continuity architecture produces a business continuity failure anyway.
Active-active without conflict resolution. Two active sites receiving writes simultaneously without a defined conflict resolution strategy produces split-brain data state. The system continues operating — and produces inconsistent, conflicting data that is worse than an outage from a recovery standpoint. Active-active for writes requires explicit conflict resolution logic. Active-active for reads is straightforward. The distinction matters before implementation, not after.
Shared control plane. Continuity patterns that depend on a control plane in the same failure domain as the failure they’re designed to route around. Circuit breakers managed by a controller that fails with the services it’s protecting. Priority routing configured in an API gateway that shares identity with the services it fronts. The architecture looks correct — the isolation isn’t real.
No load shedding. Every request treated equally under capacity pressure. Tier 0 traffic competes for the same capacity as Tier 3 traffic. Under load, the system serves everyone at degraded quality rather than serving critical traffic at full quality. Mission-critical operations fail alongside non-critical ones — not because capacity wasn’t there, but because it was allocated without prioritization.
Dependency sprawl. Microservices architectures where one service change breaks twelve downstream continuity assumptions that nobody documented. The bulkhead isolation was designed for the dependencies known at build time. Three years of organic development later, the dependency map bears no relationship to the isolation boundaries. Cascading failures in complex architectures almost always trace back to undocumented dependencies that crossed intended isolation boundaries.
Tier assignment drift. Continuity tier assignments made at build time and never reviewed. The reporting service that was Tier 2 at launch is now the primary interface for a mission-critical operational team. The feature flag that disables it under failure was never updated. The business discovers this during the first real continuity event.
Business continuity is Layer 1. The pages below are the availability and integrity layers that complete the architecture — DR that restores what BC couldn’t sustain, and recovery that validates what DR restored. Each layer is a standalone discipline. Each must connect to the others.
You’ve Read the Architecture.
Now Validate Whether Yours Actually Operates Under Failure.
Degradation ladder tier assignments, control plane isolation, circuit breaker calibration, load shedding thresholds, and the dependency maps that continuity architecture depends on — most BC architectures look correct in documentation and surface their gaps during the first real partial failure. The triage session validates whether your specific environment can actually operate during the failure scenarios this page describes — before a cascade event does it for you.
Data Protection Architecture Audit
Vendor-agnostic review of your continuity and resilience posture — degradation ladder validation, control plane isolation, traffic engineering calibration, dependency map completeness, and the tier assignment decisions your business may not know were made on their behalf.
- > Degradation ladder tier assignment review
- > Control plane isolation and single point of failure audit
- > Circuit breaker and load shedding calibration review
- > Dependency map completeness against continuity boundaries
Architecture Playbooks. Every Week.
Field-tested blueprints from real continuity environments — cascade failure post-mortems, circuit breaker calibration case studies, active-active split-brain incidents, and the degradation ladder implementations that actually held under production failure conditions.
- > Cascade Failure Patterns & Intervention Points
- > Circuit Breaker & Load Shedding Implementation
- > Active-Active Architecture & Conflict Resolution
- > Real Continuity Failure Case Studies
Zero spam. Unsubscribe anytime.
Architect’s Verdict
Recovery restores systems. Continuity protects the business.
The distinction is not semantic. DR is an interruption discipline — it accepts that systems will go down and builds the machinery to bring them back. Business continuity is an operation discipline — it rejects the premise that going down is the only option and builds the architecture to keep the business operating while the failure is still active. Both are necessary. They solve different problems in different time windows. Investing in one is not investing in the other.
The Three-Layer Resilience Model is the frame: Layer 1 operates during failure, Layer 2 restores after failure, Layer 3 validates what was restored. Most architectures build Layer 2. Most DR investments are real, functional, and tested against the scenarios they were designed to handle. The gap is Layer 1 — the Degradation Ladder that keeps the business operating during the RTO window, the control plane isolation that ensures routing decisions can be made while the failure is active, the circuit breakers that prevent a partial failure from becoming a total collapse before DR can even be declared.
The Continuity Cascade is not a theoretical failure mode. It is the standard failure pattern for architectures that built Layer 2 without Layer 1 — a partial failure that becomes total because nothing was in place to stop it at Stage 3. The cascade has intervention points. They require architecture decisions made before the failure, not responses improvised during it.
Build the ladder. Enforce the tiers. Isolate the control plane. Test all three levels before the incident that requires them. And agree with the business on which features are Tier 0 — before you discover the answer in production.
Frequently Asked Questions
Q: What is the difference between business continuity and disaster recovery?
A: DR accepts interruption and restores systems after failure — it is measured in RTO and RPO. Business continuity rejects interruption and keeps systems operating during failure — it is measured in whether the business could function while the failure was still active. DR begins after a failure is declared. BC operates during the window before and during that declaration — the window where business damage accumulates fastest. Both are required. Neither substitutes for the other.
Q: Do I need active-active architecture for business continuity?
A: Not necessarily. Active-active is the highest-cost, highest-continuity pattern — appropriate for Tier 0 mission-critical workloads with zero interruption tolerance. Most workloads can achieve effective continuity with graceful degradation, circuit breakers, and priority routing at significantly lower cost. The question is not whether to implement active-active — it is which workloads justify the cost. Active-active without conflict resolution for write operations introduces split-brain data state, which is worse than a controlled degradation.
Q: How much does business continuity architecture cost?
A: Continuity is a permanent cost — the always-on tax. Active-active infrastructure doubles your compute footprint at minimum. Feature flag systems, circuit breaker infrastructure, priority routing, and queue systems add operational and licensing overhead. The economic question is: does the always-on tax cost less than the business impact of the downtime you are preventing? At $500K+ per hour of enterprise downtime, the math usually favors continuity for Tier 0 and Tier 1 workloads. For batch systems, internal tools, and dev/test environments, it usually doesn’t.
Q: Can cloud-native architecture replace BC planning?
A: No. Cloud-native architecture provides the building blocks — managed services, multi-region deployments, auto-scaling, health checks. It does not provide the degradation logic, tier assignments, control plane isolation, or dependency maps that business continuity requires. A multi-region cloud deployment with a shared DNS control plane fails as a unit when DNS fails. The cloud provides infrastructure resilience. BC architecture provides operational resilience. Both are required.
Q: What breaks first in a real continuity failure?
A: The retry logic. When a partial failure produces errors, clients retry immediately — multiplying the load on the degraded service by 3–5x. Without circuit breakers and exponential backoff, the retry storm is indistinguishable from a self-inflicted DDoS. The retry storm is Stage 3 of the Continuity Cascade — and it is the last stage where intervention is straightforward. After Stage 3, every subsequent stage is harder to stop.
Q: Is load shedding the same as rate limiting?
A: No. Rate limiting controls how many requests a single client or API key can make in a time window — it is primarily a security and fairness control. Load shedding controls how many total requests the system accepts under capacity pressure — it is a continuity control. Rate limiting protects against individual abusive clients. Load shedding protects against total system overload by deliberately dropping lower-priority traffic when capacity is constrained. Both are useful. They solve different problems.
Q: When does graceful degradation become a product decision?
A: Always. The enforcement mechanism is engineering — feature flags, circuit breakers, priority routing. But what to degrade, in what order, for which users, is a product and business decision. Engineering teams that implement degradation ladders without business input discover during the first real incident that they degraded the wrong features for the wrong users. The tier assignments in the Degradation Ladder are not infrastructure parameters. They are business priorities enforced by infrastructure.