DISASTER RECOVERY & FAILOVER
Failover Starts Systems. Recovery Proves Them.
Disaster recovery failover is not the same as recovery. Most organizations have a plan for one and assume it covers both.
The distinction matters more than it sounds. DR is an availability discipline — it describes how infrastructure is restored when systems go down. Recovery is an integrity discipline — it describes how you prove that what came back up is clean, correct, and trustworthy. DR can succeed completely while recovery fails entirely. Infrastructure boots. Applications produce wrong answers. Data reflects a compromised state. The failover worked. The recovery did not.
The gap between these two disciplines is where ransomware operators live. It is where undocumented application dependencies surface. It is where identity plane assumptions collapse under real incident conditions. Building DR without building recovery is building confidence in the wrong metric. This page covers both layers — and the architecture required to make failover mean something beyond infrastructure boot.
The Disaster Recovery Illusion
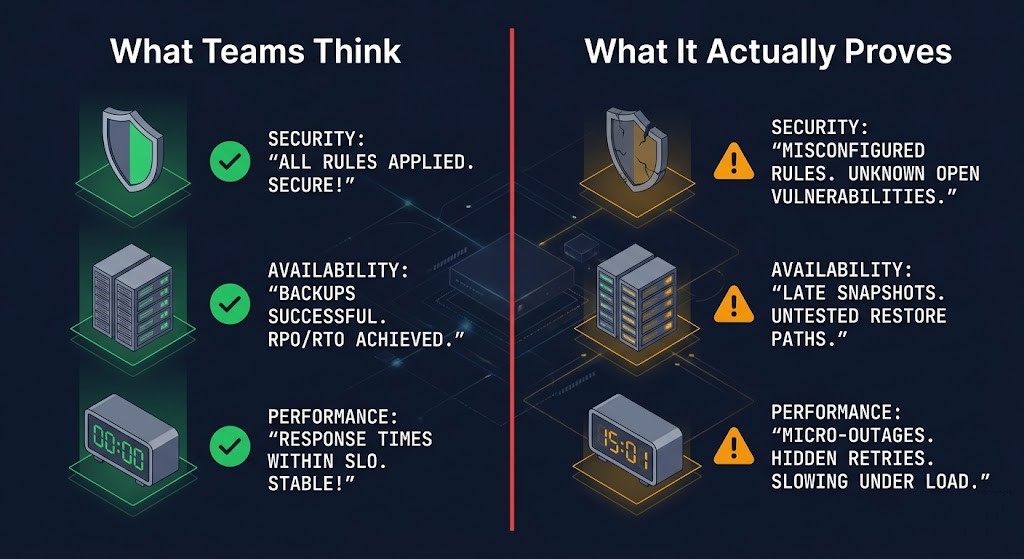
DR testing produces a specific kind of false confidence. The infrastructure came up. The RTO was met. The checklist was completed. And none of that tells you whether what came back up is trustworthy.
The mental model most teams carry into DR planning conflates availability with integrity — treating a successful failover as proof of recovery. It is not. Failover proves that systems can start. Recovery proves that what started is correct.
| What Teams Think DR Proves | What It Actually Proves |
|---|---|
| Systems are protected | Systems can start |
| Failover works | DNS flipped — application state unvalidated |
| RTO is met | Infrastructure boots within the window |
| Business continuity is assured | Nothing about data integrity or security state |
| Replication equals protection | Compromised state was faithfully replicated to DR site |
DR validates infrastructure. Recovery validates outcomes.
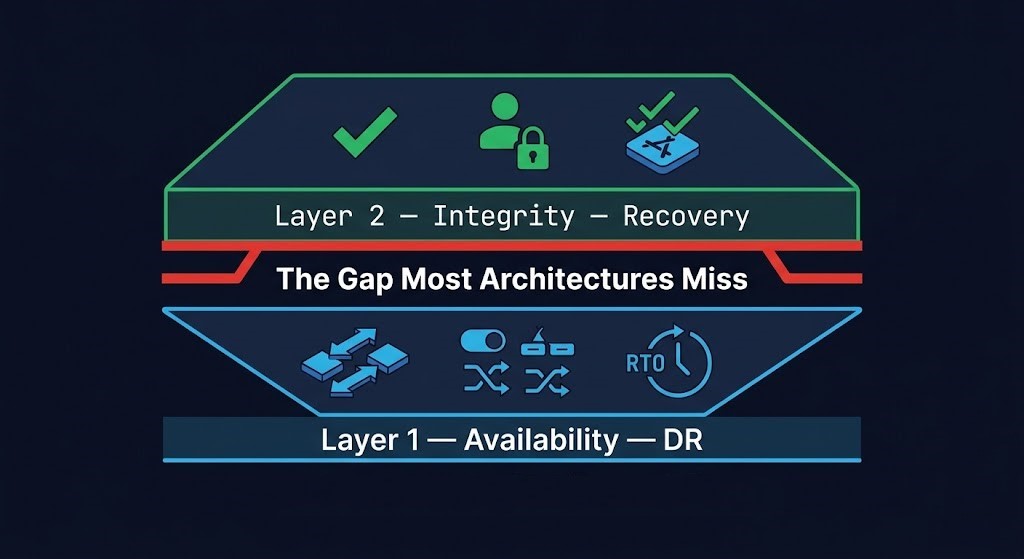
The Rack2Cloud Resilience Model — Availability ≠ Integrity
Complete resilience architecture operates on two distinct layers. Most organizations build Layer 1 and assume Layer 2 is implied. It is not — and the gap between them is precisely where real-world recovery fails.
| Layer | What It Solves | What It Fails At | Primary Metric |
|---|---|---|---|
| Layer 1 — DR | Downtime, infrastructure availability | Compromised data, integrity validation | RTO |
| Layer 2 — Recovery | Data integrity, security state, clean restart | Fast failover under time pressure | Recovery Assurance |
An architecture missing Layer 2 has built availability, not resilience. Under normal failure conditions — hardware failure, regional outage, accidental deletion — Layer 1 is sufficient. Under adversarial conditions, Layer 1 fails precisely because it was designed for a threat model the attacker already defeated.
The full recovery model — three planes, five protection primitives, and the identity architecture that makes both layers defensible under adversarial conditions — is the subject of the Data Protection Architecture pillar. This page covers the availability layer and the sequencing logic that determines whether the integrity layer can function after it.
What Disaster Recovery Failover Actually Is
Disaster recovery is the architecture that restores infrastructure availability after a failure event. It covers the replication of data to secondary sites, the orchestration of failover sequencing, the network topology that enables traffic redirection, and the RTO/RPO targets that define acceptable recovery windows.
What DR is not: a substitute for backup. A substitute for recovery testing. A substitute for identity isolation. A substitute for an independent copy of clean data.
Replication — the core mechanism of most DR architectures — produces a consistent copy of production data. The word “consistent” is doing important work in that sentence. Replication produces a copy consistent with the production state at the time of replication. If that production state includes four days of attacker dwell time, catalog deletion, and pre-encryption staging activity, the DR replica faithfully replicates all of it. Failover to that DR site does not recover the environment. It recovers the compromised state the attacker prepared.
DR solves downtime. It does not solve integrity. Understanding the boundary between those two disciplines is the architectural foundation that makes everything else on this page work. For the adversarial dimension of that boundary — and the six patterns ransomware uses to defeat DR-only architectures — see Cybersecurity & Ransomware Survival. For the RTO, RPO, and RTA metrics that should be driving architecture decisions rather than measuring outcomes, see the RTO/RPO/RTA framework.
DR Architecture Decision Matrix
Four DR models exist on a cost-RTO spectrum. The right model is a function of workload criticality, budget, and the RTO target that has actually been tested — not the one in the documentation.
The model selection is the easy part. The harder decision is which RTO target you are actually committing to — the one in the documentation, or the one you have validated under real conditions. The Cloud DR Plan covers the Pilot Light pattern in full depth including scale-up timing under real incident pressure.
DR Topologies
Topology selection determines failure domain, latency exposure, and the cost model at both steady-state and incident scale. Each topology solves a specific failure domain and introduces specific constraints.
| Topology | Failure Domain | RPO | RTO | Cost Profile |
|---|---|---|---|---|
| Single Region + Backup | Site-level hardware / facility | Hours | Hours to days | Low |
| Multi-Region Active-Passive | Regional cloud / data center outage | Minutes | Minutes to hours | Medium |
| Multi-Region Active-Active | Full regional failure, global-scale | Near-zero | Near-zero | High |
| Hybrid DR (on-prem + cloud) | On-prem facility, configurable scope | Configurable | Configurable | Variable |
Topology selection is a failure domain decision before it is a cost decision. The failure domain you are protecting against determines the minimum separation required. A second data center in the same metro solves a facility failure but not a regional utility outage. A second cloud region solves a regional AZ failure but not a control plane compromise that spans both regions through shared identity. The metro risk and disconnected cloud physics post covers the latency and connectivity constraints that shape hybrid topology decisions.
Replication Architecture
Replication is the data movement layer that makes DR possible. The replication model determines your RPO — the amount of data you accept losing — and introduces constraints on distance, application performance, and recovery point integrity.
| Model | RPO | RTO Impact | Distance Constraint | Primary Failure Mode |
|---|---|---|---|---|
| Synchronous | Near-zero | Write latency penalty in production | < ~100km / ~1ms RTT | WAN latency degrades app performance beyond distance threshold |
| Asynchronous | Minutes to hours | Dependent on recovery point age at incident time | Unconstrained | Data loss window = replication lag at moment of incident |
| NearSync | Seconds (checkpoint-based) | Low overhead vs synchronous | Metro / regional | Recovery granularity depends on checkpoint frequency — not true zero RPO |
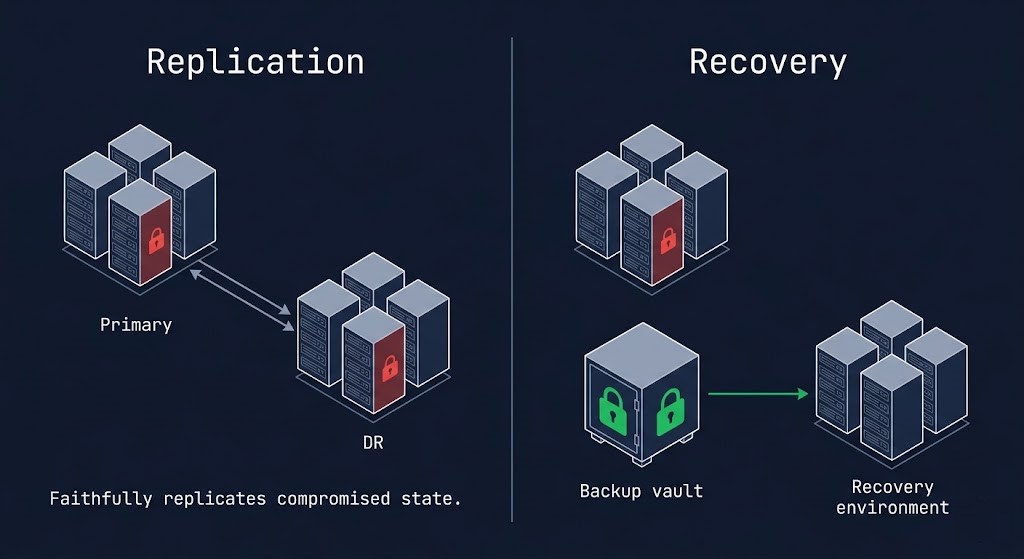
The replication poisoning problem applies to all three models. Replication does not distinguish between clean and compromised state — it copies whatever is in production at the time. An asynchronous replication schedule running normally through a four-day ransomware dwell period delivers a poisoned DR site. A synchronous replica mirrors the pre-encryption staging activity in real time. The replication model determines RPO under normal conditions. It does not determine whether the recovery point you replicated to is trustworthy.
The separation that solves replication poisoning is an independent backup tier with retention that predates the compromise window — a Layer 2 component that replication cannot substitute for. The Nutanix NearSync vs VMware SRM comparison covers the replication architecture tradeoffs for HCI environments in detail.
Failover Logic
Failover is not a single action. It is a sequenced set of decisions and operations that must happen in the correct order, with the correct dependencies validated at each step, against a declaration threshold that was defined before the incident — not during it.
The declaration threshold problem. Most organizations have no documented criteria for when a DR failover is declared. The decision is made ad hoc under incident pressure, by engineers who haven’t slept, with executives watching. Automated failover removes the human delay — and introduces the risk of false positive declaration and split-brain scenarios where both sites believe they are primary simultaneously. The threshold must be defined, documented, and tested before the incident that requires it.
Automated vs manual failover. Automation is appropriate when the failure mode is clearly detectable and unambiguous — complete site failure, sustained replication lag beyond threshold, confirmed infrastructure loss. Manual is appropriate when the failure mode could be a network partition, a false positive alert, or a partial failure where failover would make the situation worse. The answer is almost always: automate the detection, human-approve the declaration.
| Failure Point | What Breaks | Why |
|---|---|---|
| DNS cutover | Users still hitting old site after failover | TTL not pre-staged — cached resolution persists for hours |
| Database not sequenced first | Application tier crashes on startup | Dependency order wrong — app connects before DB is ready |
| Identity not bootstrapped | Auth fails across all restored workloads simultaneously | Directory services not provisioned at DR site — every workload fails auth |
| Network segmentation mismatch | Partial connectivity — some workloads reach dependencies, others don’t | Firewall rules and security groups not mirrored at DR site |
| Certificate expiry | HTTPS fails across all services — browser security warnings, API failures | Cert renewal tied to production CA that isn’t reachable from DR environment |
| Secrets unavailable | Applications cannot authenticate to databases, APIs, or external services | Vault or secrets manager not replicated — or identity plane wrong at DR site |
| IP remapping incomplete | Cross-workload traffic fails — hardcoded IPs in app configs break | Application config uses IPs not resolvable in DR network topology |
Every failure mode in this table has one root cause: it was not tested. The dependency map existed in someone’s head, not in the DR runbook. The VMware policy migration post covers the specific complexity of translating DRS, SRM, and NSX policies to alternative platforms — the same dependency mapping problem under a migration lens.
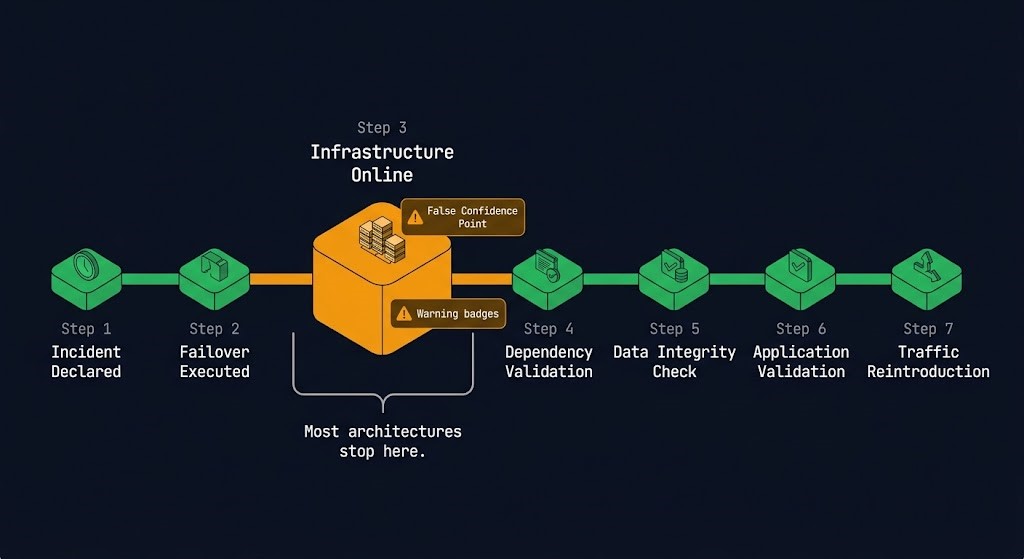
The Recovery Sequence — What Actually Happens After Failover
Failover is step two. Most DR plans treat it as the final step. What comes after is where recovery actually succeeds or fails — and it requires seven distinct phases that must happen in order, with validation at each step.
The RTO/RPO/RTA framework covers how to use recovery metrics as architectural inputs — defining which steps must complete within the RTO window, not just which infrastructure must boot.
The DR Control Plane Problem
If your DR orchestration shares identity with production, it fails under ransomware. This is not a configuration gap — it is an architectural one. And it is the most common single point of failure in enterprise DR architectures.
DR orchestration tools — VMware SRM, Azure Site Recovery, Zerto, Veeam — all require management plane access to execute failover. That management plane is authenticated. The credentials that authenticate it live somewhere. In most deployments, they live in the same Active Directory, the same credential vault, and the same management network as the production environment they are protecting. When that production environment is compromised, the DR orchestration platform is compromised with it.
The attacker does not need to break DR. They log into it.
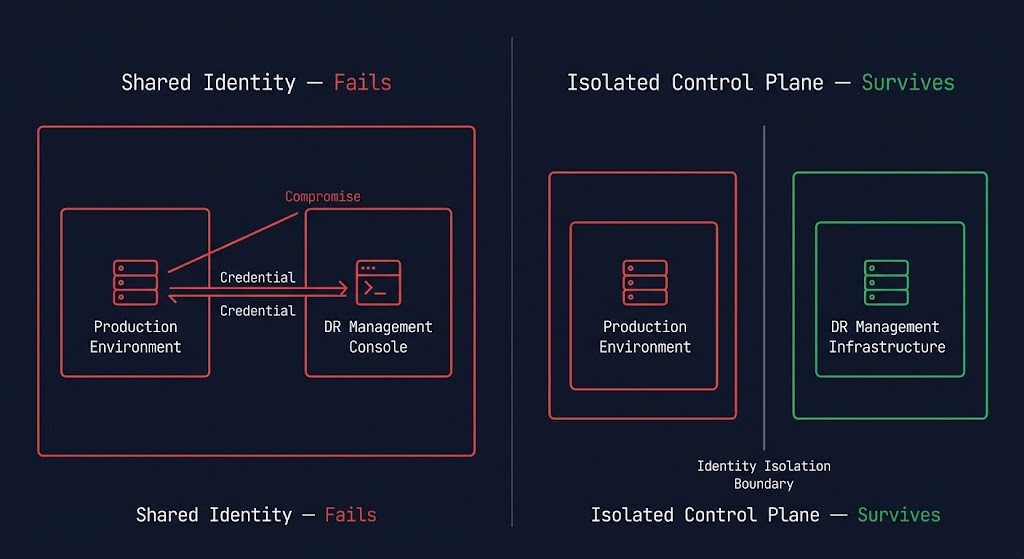
The API reachability test. For any DR orchestration tool in your environment: can the production management network reach the DR platform’s API endpoint? If yes — and if production admin credentials have access to that endpoint — then a compromised production environment has access to your DR platform. That is not isolated control plane architecture. That is a shared attack surface wearing the costume of redundancy.
Identity defines the blast radius. DR either respects that boundary — or inherits it.
The three controls that determine whether DR control plane isolation is real: separate identity plane for DR management credentials; API authentication that requires credentials not present in the production environment; and a management network that has no path from production VLANs to DR orchestration endpoints. All three must be present. Any one absent collapses the isolation.
The full identity architecture — three separate planes for production, backup, and recovery — is covered in detail in the Cybersecurity & Ransomware Survival page. The Data Hardening page covers the API-layer deletion controls that extend this isolation to backup management operations.
Cost Physics of Disaster Recovery
DR has two cost models. Most organizations model the first and discover the second during an incident — when cost approval processes add hours to a recovery timeline that was already under pressure.
Steady-State Cost — what you pay to maintain DR readiness under normal operations:
Failure-State Cost — what you pay when DR is triggered, which was never in the budget:
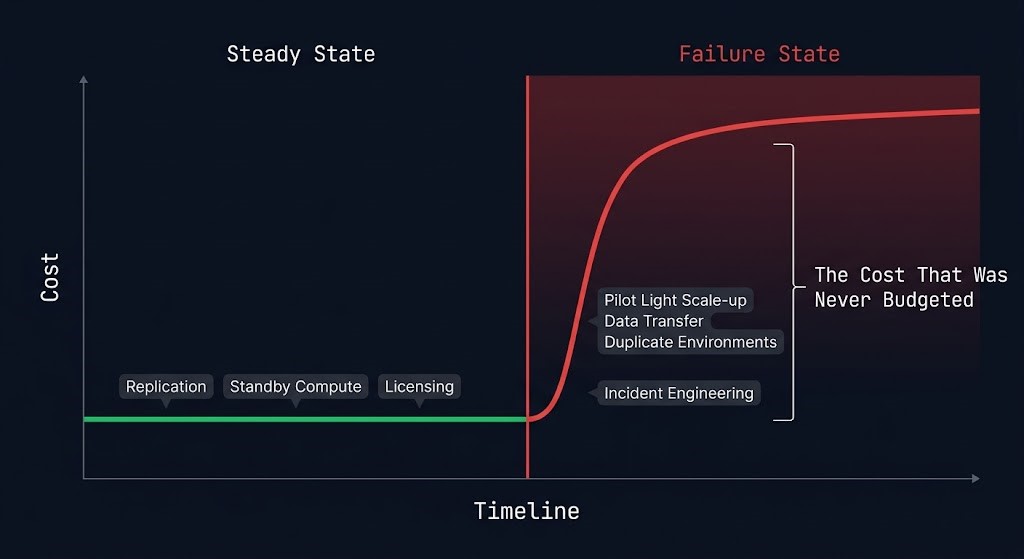
DR cost is not what you pay to maintain it. It is what you pay when you trigger it — and that cost was never in the budget.
The cost inversion pattern mirrors the backup cost physics covered in the Data Protection Architecture pillar: architectures optimized for steady-state economics tend to produce the worst failure-state cost profiles. Model the incident cost, not the steady-state cost.
Platform Architecture
Platform selection determines how much of the DR architecture the tooling provides and how much you must build around it. The two criteria that differentiate platforms under adversarial conditions — control plane isolation and immutability enforcement model — are more important than any feature comparison under normal conditions.
| Platform | Strength | Weakness | Best Fit |
|---|---|---|---|
| VMware SRM | Mature policy-based orchestration, deep vSphere integration, proven at enterprise scale | Broadcom cost pressure, vSphere dependency, management plane inside customer environment | Existing VMware shops in migration window — not a long-term investment |
| Nutanix Leap / NearSync | Integrated with HCI stack, low RPO via NearSync, simplified operational model | Nutanix ecosystem dependency, management plane in customer environment by default | HCI-first environments already committed to Nutanix stack |
| Azure Site Recovery | Native Azure integration, supports on-prem to Azure failover, managed service model | Complexity at scale, Azure-first bias, additional licensing on top of Azure compute | Azure-first workloads with hybrid on-prem + cloud DR requirements |
| AWS Route 53 ARC + DR patterns | Flexible multi-region patterns, Route 53 ARC for traffic shifting, native cloud-native DR | DIY orchestration overhead — AWS provides building blocks, not a DR product | Cloud-native architectures with multi-region requirements and engineering capacity to build |
| Zerto | Platform-agnostic, journal-based continuous replication, seconds RPO, cloud and on-prem | Additional licensing layer on top of existing infrastructure, management plane in-environment | Mixed/hybrid environments needing platform-agnostic DR orchestration |
| Veeam DR | Broad platform support, integrated backup + DR, familiar operational model for backup-first teams | Backup architecture — DR is an add-on capability, not a purpose-built DR platform | Environments already standardized on Veeam backup wanting integrated DR without additional tooling |
The platform decision is secondary to the identity isolation architecture described in the Control Plane section. A best-in-class DR platform deployed with shared identity into the production environment provides weaker adversarial resilience than a simpler platform deployed with proper identity isolation. The Nutanix NearSync vs VMware SRM comparison covers the HCI-specific tradeoffs. The disaggregated HCI architecture post covers how DR topology changes when compute and storage are separated.
Failover Testing
A DR plan that has never been tested is a theory. A DR plan tested only at the infrastructure layer is a partially validated theory. Recovery confidence requires four conditions — all four, not three of four.
The most common gap is criterion two — the dependency map. Most environments have cross-workload dependencies that are undocumented because they were never discovered during normal operations. They surface during real failovers when an application tier that always worked suddenly can’t resolve a dependency that was implicitly provided by an adjacent system. The test reveals it. The incident exposes it under pressure with no time to fix it.
DR Decision Framework
| Workload Tier | DR Model | RTO Target | RPO Target | Test Frequency |
|---|---|---|---|---|
| Tier 0 — Mission Critical Transaction DBs, identity, core infra |
Active-Active or Warm Standby | < 15 min | Near-zero | Quarterly |
| Tier 1 — Business Critical App servers, file services, collaboration |
Warm Standby or Pilot Light | < 4 hrs | < 1 hr | Semi-annual |
| Tier 2 — Operational Non-critical apps, reporting, internal tools |
Backup & Restore | < 24 hrs | < 4 hrs | Annual |
| Dev / Test Non-production, ephemeral workloads |
Backup & Restore or rebuild | Best effort | Best effort | On-demand |
When DR Works — and When It Fails
| Scenario | DR Replication | Independent Backup Tier |
|---|---|---|
| Hardware failure | ✓ Effective — clean failover | ✓ Effective |
| Accidental deletion | ✓ Effective with point-in-time | ✓ Effective |
| Regional outage | ✓ Effective | ✓ Effective |
| Ransomware — encryption only | ✗ May replicate pre-encryption state | ✓ Effective if retention predates compromise |
| Ransomware — catalog + retention manipulation | ✗ Replicates compromised state to DR site | ⚠ Effective only if backup tier is identity-isolated |
| Full control plane compromise | ✗ DR management plane also compromised if shared identity | ⚠ Effective only with air-gapped tier + isolated identity |
| Data corruption | ✗ Replication faithfully copies corrupted state | ✓ Effective from pre-corruption recovery point |
When DR Is the Wrong Solution
DR is an availability tool. Applying it to problems that require an integrity tool produces architectures that look correct in documentation and fail under the conditions they were designed to address.
Disaster recovery is the availability layer. The pages below are the integrity layer and the operational disciplines that connect them. DR without backup is availability without recovery. DR without cybersecurity architecture is a failover that delivers the attacker’s environment. DR without business continuity is infrastructure that came back online while the business couldn’t operate.
You’ve Read the Architecture.
Now Validate Whether Yours Actually Fails Over — and Recovers.
Declaration thresholds, dependency maps, control plane identity isolation, replication model validity, recovery sequence completeness — most DR architectures look correct in documentation and surface their gaps during real incidents. The triage session validates whether your specific environment can actually execute the recovery sequence this page describes before an incident does it for you.
Data Protection Architecture Audit
Vendor-agnostic review of your DR and recovery posture — failover sequencing completeness, dependency map validation, control plane identity isolation, replication model validity under adversarial conditions, and recovery confidence against all four criteria.
- > DR control plane identity isolation audit
- > Replication model validity and poisoning exposure
- > Recovery sequence completeness — Steps 4–7
- > RTO/RPO commitments vs validated recovery capability
Architecture Playbooks. Every Week.
Field-tested blueprints from real DR environments — replication poisoning incidents, failover sequence failure post-mortems, control plane compromise case studies, and the recovery architectures that actually work when everything else has already failed.
- > DR Failover Sequence & Dependency Mapping
- > Replication Architecture & Poisoning Patterns
- > Control Plane Isolation & Identity Architecture
- > Real Recovery Failure Case Studies
Zero spam. Unsubscribe anytime.
Architect’s Verdict
The Rack2Cloud Resilience Model — Availability ≠ Integrity — is the frame that every DR architecture decision should be tested against before it is committed to infrastructure.
Layer 1 — DR — is well understood and widely implemented. Infrastructure fails over. Systems come back online. The dashboard turns green. This layer is necessary. It is not sufficient. An architecture that builds only Layer 1 has built the ability to start systems — not the confidence that what started is trustworthy.
Layer 2 — Recovery — is where most architectures have the largest gap. The recovery sequence that stops at Step 3. The dependency map that exists in one engineer’s head. The DR control plane that shares identity with the production environment it is protecting. The application validation that never happened because the VM booted and the executive watching the call said “looks good.” Layer 2 requires explicit architecture work — identity isolation, tested recovery sequences, application-layer validation, documented runbooks executed by people who didn’t write them.
The failure modes this page describes are not edge cases. They are the standard failure pattern for DR architectures that were built for normal conditions and tested with the assumption that the failure mode would be polite enough to look like the scenario in the runbook.
Ransomware doesn’t look like the scenario in the runbook. Hardware failure at 3AM doesn’t look like the quarterly test. Regional outages don’t happen during business hours when the full team is available. The DR architecture that holds is the one that was stress-tested before the incident — with real dependency discovery, real application validation, and real recovery sequence execution — not the one that passed the annual checklist.
Failover starts systems. Recovery proves them. Build both layers.
Frequently Asked Questions
Q: What is the difference between disaster recovery and backup?
A: Backup is a copy of data stored separately from production — the raw material for recovery. Disaster recovery is the architecture and orchestration that restores infrastructure availability using that copy, plus the replication, failover sequencing, and network topology that enables recovery at the required speed. Backup solves the data preservation problem. DR solves the availability restoration problem. Neither solves the integrity problem alone — that requires the Layer 2 recovery architecture that validates what came back is trustworthy.
Q: What is RPO vs RTO in practice?
A: RPO — Recovery Point Objective — is how much data you can afford to lose, measured in time: the gap between the last clean recovery point and the incident. A 1-hour RPO means you accept losing up to 1 hour of transactions. RTO — Recovery Time Objective — is how fast systems must return to service, measured from incident declaration to validated production resumption. Both are architectural inputs that should design your infrastructure before an incident, not measurements you take after one to explain why recovery took longer than expected.
Q: Is replication enough for disaster recovery?
A: Replication is the data movement layer of DR — it provides the copy that failover uses. It is necessary but not sufficient. Replication produces a consistent copy of production state, including any compromised or corrupted state. An architecture that relies only on replication has no protection against ransomware (which replicates the compromised environment to the DR site), data corruption (which replicates the corrupted state), or control plane compromise (which may include the DR management platform). An independent backup tier with retention that predates potential compromise windows is required alongside replication, not as a substitute for it.
Q: What is pilot light architecture?
A: Pilot light is a DR topology where a minimal infrastructure footprint is kept running at the DR site — core services at reduced capacity, sufficient to scale to full production on failover. The cost advantage is that you pay for minimal standby infrastructure during normal operations, not full DR capacity. The failure mode is scale-up time: activating a pilot light environment under real incident pressure takes time that the documented RTO may not account for. Pilot light is appropriate for cloud-native workloads with variable traffic and cost-sensitive Tier 1 requirements where hours of RTO is acceptable.
Q: How often should DR be tested?
A: Tier 0 mission-critical workloads: quarterly minimum. Tier 1 business-critical: semi-annual minimum. The frequency matters less than what you test. A quarterly test that validates only infrastructure boot is not a quarterly test of recovery — it is a quarterly test of VM startup. A valid DR test executes the full recovery sequence through application-layer validation, surfaces undocumented dependencies, and is executed by someone other than the person who wrote the runbook.
Q: What breaks first in a real DR failover?
A: The dependency map. Most DR environments have cross-workload dependencies that were never documented because they were never needed during normal operations — DNS resolution patterns, certificate chains, secrets manager access paths, database connection strings hardcoded in application configs. These surface during real failovers when something that always worked silently stops working in the DR environment. The test reveals them before the incident. The incident reveals them under pressure with no time to fix them.
Q: Does DR protect against ransomware?
A: Not reliably, and not alone. DR replication faithfully copies state — including the compromised state an attacker has spent days preparing before detonation. Failing over to a DR site after a ransomware incident often delivers the environment the attacker configured, not a clean recovery. DR protects against availability failures — hardware failure, regional outage, accidental deletion. Ransomware is an integrity failure. The architecture that survives ransomware requires an independent backup tier with retention that predates the compromise window, identity isolation that prevents the attacker from reaching the backup and DR management planes, and a tested recovery sequence that validates data integrity before reconnecting restored workloads to production.